
The turnaround in gold and the Precious Metals sector on Friday was really dramatic with gold dropping about $80 from its 11 am EDT peak and this brought out the old explanation about “the powers that be” cratering it by burying it with paper shorts. However, as we will see there may be a simpler explanation.
Gold had risen a lot by last Friday to become extremely overbought and it appears that a part of this rise was due to the fear factor relating to Iran attacking Israel and starting World War 3.
This has set gold up for a “sell on the news event” where it drops when Iran actually does attack Israel, especially if, as seems to be the case at the time of writing, Iran simply lobs some fireworks at Israel so that “honor is satisfied” with most of these drones or missiles being shot down and those that arrive do little damage.
While hostilities may continue at a low key level it appears that Iran is behaving with some restraint in order to avoid inciting intervention by the US which is Israel’s giant henchman.
To answer the question where gold and the PM sector generally is headed we are probably better using the language of the market itself and seeing what the charts have to say.
The prediction in the last Gold Market update posted on March 16th turned out to be correct as the following chart from that update shows, even if it took a little longer to get moving than expected...
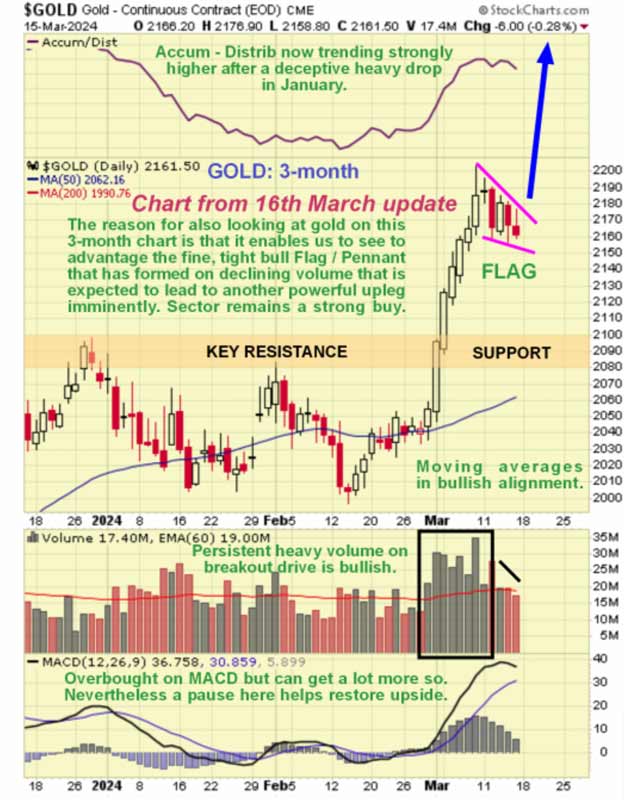
So we will now look at gold’s latest 3-month chart to see what happened, and more importantly what it portends for the future. Before going any further it should be pointed out that because the last prediction was correct, it doesn’t mean that today’s will be.
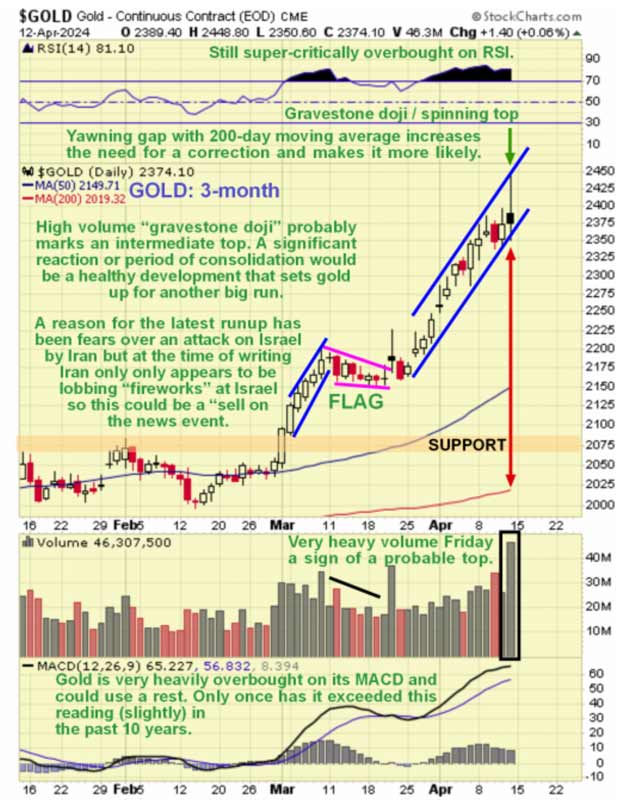
As we can see, after the last update was posted gold did indeed break out upside from its bull Flag to enter a strong uptrend that took it up to approach $2450 early Friday at which point it had become extremely overbought – only once in the past 10 years has it gotten more overbought, and that was only by a small margin.
It has been super-critically overbought on its RSI indicator pretty much all this month so far which itself is a warning, with a much more dire warning appearing on Friday with the dramatic high volume intraday reversal candle that can be described as a gravestone doji / spinning top, both of which are bearish in this position and indicate a reversal.
This suggests that Smart Money had figured out that Iran’s attack on Israel would be a “nothingburger” so they took profits. Another reason for gold to consolidate or correct back here is the huge gap that the price has opened up with the 200-day moving average which is a measure of how overbought it is.
If gold does react back how much might it drop? – probably not much given the other much more serious bullish factors in play that aren’t going anywhere. It is thought unlikely that it will correct back further than about $2250 and it shouldn’t drop as far as the preceding Flag.
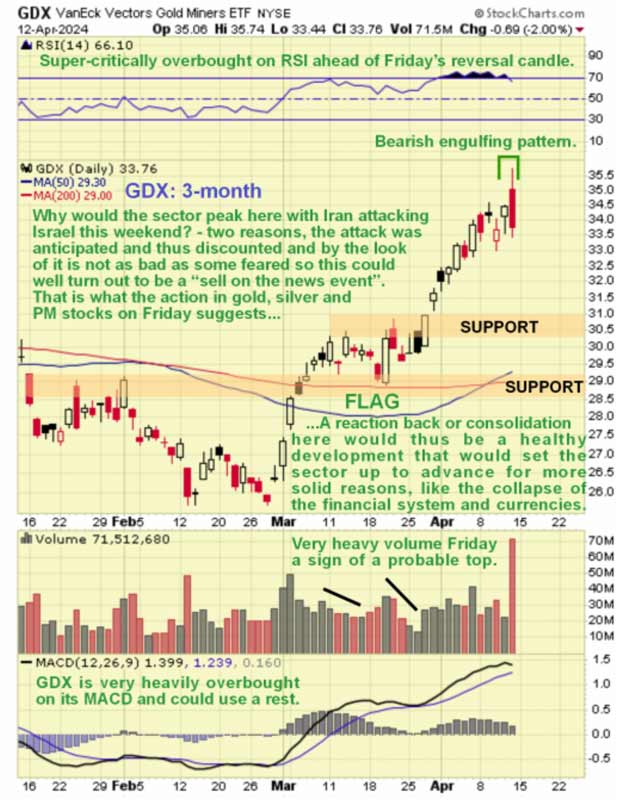
So what about PM stocks? They also put in bearish candles on Friday with the proxy ETF, GDX putting in a prominent “bearish engulfing pattern” on its chart on Friday as we can see on its 3-month chart below. This indicates a reversal, especially as it occurred on high volume – the biggest for 2 years.
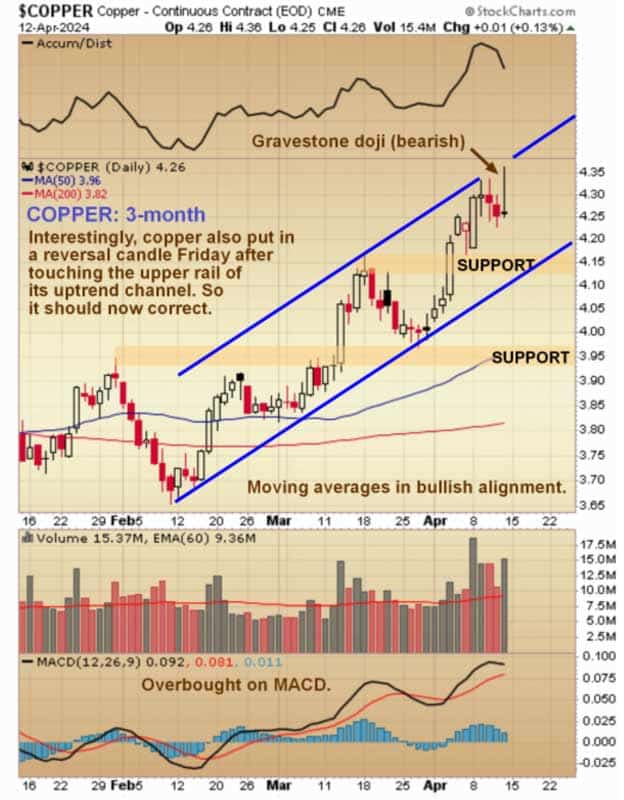
Interestingly, copper also put in a bearish looking candle on quite high volume on Friday, a so-called “gravestone doji” which is where the open and close are close together near to the bottom of the day’s range…
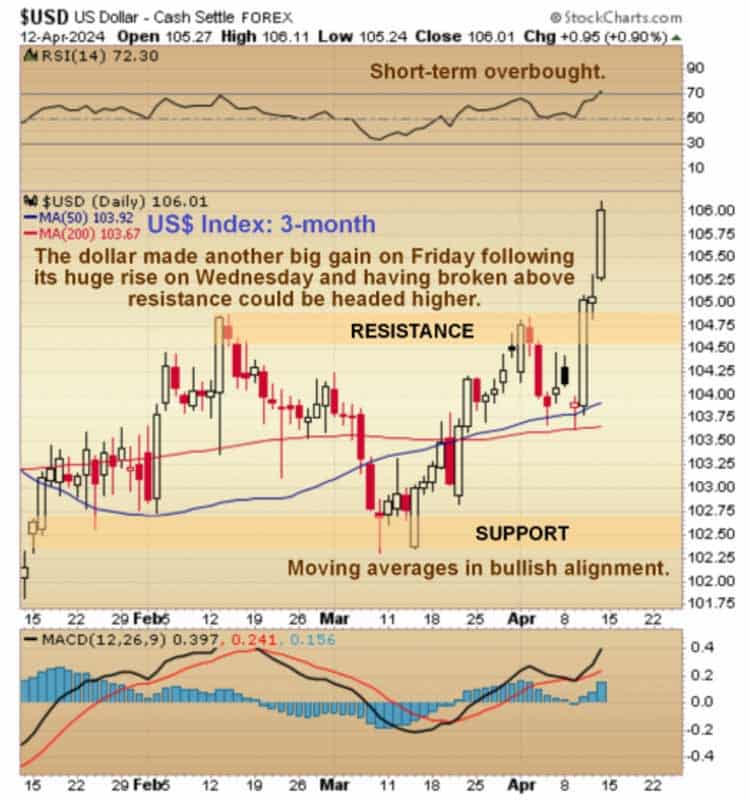
The dollar, meanwhile, has done well on the fear trade, breaking strongly higher above resistance on Wednesday and following through with another big gain on Friday and while it is getting short-term overbought and so might consolidate or react back some, at this point it looks like it wants to go higher still.
Some folks on Friday morning thought that we had entered a nirvana where the dollar and gold would rally strongly in tandem, but alas that proved to be false.
So this is thought to be a good time to scale back positions somewhat in the PM sector, with a view to buying back at better prices on a reaction or taking the opportunity to rebalance portfolios to include the strongest stocks in the sector. Where you have big gains in some stocks it might work out well to say take profits on half, then buy back after a reaction or consolidation or reposition into better stocks.

About the Author:
Clive P. Maund is a longtime trader who has provided professional chart analysis for over a decade, covering a wide range of markets with a special focus on the resource sector. In addition to his decades of trading experience and financial research, Clive obtained a UK Society of Technical Analysts diploma. His website is CliveMaund.com.
